Average Miles Driven Per Year — and What It Says About an Odometer
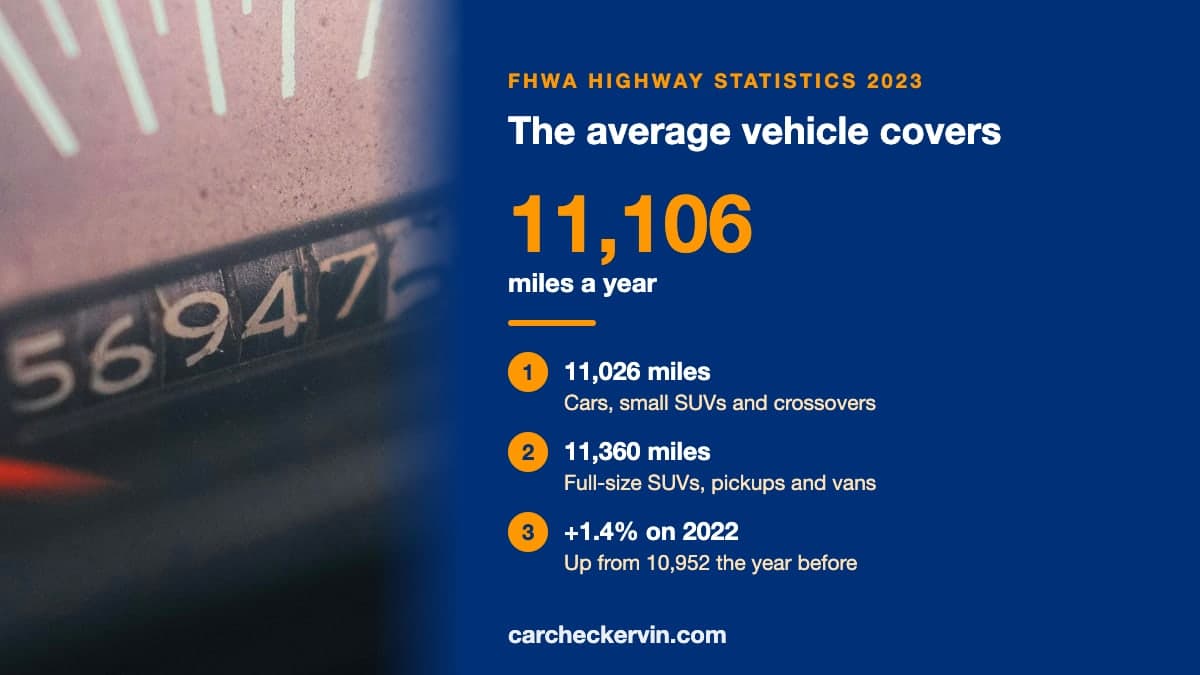
The average light-duty vehicle in the United States covers 11,106 miles a year. Run a VIN below to see the odometer readings actually recorded against a specific car.
Check a car’s real odometer history
Free VIN decode and recall check. Full NMVTIS report $14.99.
No account needed. We never sell your data.
Average Miles Per Year — By the Numbers
- Miles a year, average light-duty vehicle
- 11,106
- Cars, small SUVs and crossovers
- 11,026
- Full-size SUVs, pickups and vans
- 11,360
- Miles a year per licensed driver
- 13,662
- Change on 2022
- +1.4%
Miles a year, average light-duty vehicle
Cars, small SUVs and crossovers
Full-size SUVs, pickups and vans
Miles a year per licensed driver
Change on 2022
Quick Answer
- What is the average miles driven per year?
- 11,106 miles per light-duty vehicle, per year — FHWA Highway Statistics 2023, Table VM-1, across 259,238,294 registered vehicles. Cars and small crossovers average 11,026; full-size SUVs, pickups and vans 11,360.
- Why do other sites say 13,662?
- Because 13,662 is miles per licensed driver, not per vehicle. Households register more vehicles than they drive on any given day, so the per-vehicle figure is lower. When you are judging one car’s odometer, per vehicle is the number that applies.
- How do I use this to check a used car?
- Multiply 11,106 by the car’s age for a rough expectation, then allow a wide margin either side. A reading well outside it is a question, not a verdict — the answer is in the odometer readings recorded at each title transfer, which a VIN check reads from NMVTIS.
The number, and where it comes from
The Federal Highway Administration publishes this figure every year in Highway Statistics, Table VM-1. For 2023 it divides total light-duty vehicle travel by the 259,238,294 light-duty vehicles registered in the country and gets 11,106 miles per vehicle. That is up from 10,952 in 2022, a rise of 1.4%.
It is a national average of an enormously varied fleet, so treat it as a yardstick rather than a rule. What it is genuinely good for is the question a used-car buyer actually has: does the number on this dashboard look like a car that has been driven normally for its age?
This page does three things with it. It breaks the average out by vehicle type, because a motorcycle and a tractor-trailer are both in that one number. It converts the rate into an expected odometer range at each age. And it separates the per-vehicle figure from the per-licensed-driver one that most articles quote instead.
One average hides six very different vehicles
A motorcycle averages 2,121 miles a year. A tractor-trailer averages 58,890. Quoting one figure for “a vehicle” flattens a spread of roughly 28 to one, which is why a used-car listing with 65,000 miles means something different on a pickup than on a bike.
What the odometer should read, by age
Multiply the light-duty average by the car’s age and you get a reasonable expectation. The band below is deliberately wide, because a garage-kept second car and a daily commuter are both perfectly normal and a single number would call half of all honest cars suspicious.
The average tells you what is normal. The VIN tells you what happened.
Odometer readings are recorded at every title transfer, inspection and auction sale. A VIN check reads them back in order.
Per driver or per vehicle? They are different numbers
Search this question and most answers land near 13,662miles. That figure is real — it is all-vehicle travel over the 237,655,885 people holding a licence (FHWA Table DL-1C). But it is miles per licensed driver. VM-1 divides the same travel by the number of people holding licences. FHWA’s VM-1 table divides the same travel by the number of registered vehicles instead, and gets 11,106.
Neither is wrong. They answer different questions. A household with three cars and two drivers puts the same miles on more vehicles, so per-vehicle comes out lower. If you are budgeting fuel for a person, use the driver figure. If you are looking at one car’s odometer and asking whether it adds up, use the vehicle figure — that car is one registration, not one driver.
FHWA Table VM-1, light duty. The right yardstick for one car's odometer.
All-vehicle travel over 237,655,885 licence holders (FHWA Table DL-1C). The right yardstick for one person's fuel or insurance mileage.
Why state figures are not a driving league table
FHWA also publishes travel by state (Table VM-2) and registrations by state (MV-1), and dividing one by the other is tempting. The result is real arithmetic — the state columns add up to the national totals exactly — but it is not a measure of how far people drive. The numerator carries freight moving through the state, and the denominator carries whatever that state chooses to register: trailers, farm equipment, out-of-state fleets.
- Delaware21,826
- Mississippi18,370
- New Mexico14,755
- Indiana14,754
- Missouri14,683
- Montana5,812
- South Dakota7,469
- Washington8,034
- Alaska8,249
- Hawaii8,264
Delaware leads and Montana trails because of those registration bases, not because of anyone’s commute. Use these to understand the measure, not to judge a seller by their plate. Source: FHWA Highway Statistics 2023, Tables VM-2 and MV-1.
When mileage is actually a red flag
An unusual reading is a prompt to look further, never a finding on its own. These are the patterns worth stopping for.
- The reading went down
Odometer values are recorded at title transfers and inspections. A later record showing fewer miles than an earlier one is the clearest rollback evidence there is, and it is in the federal title record rather than on the dash.
- Far below the band for its age
A 10-year-old car showing 30,000 miles is possible and it is also what a rollback looks like. The expectation at that age is around 111,000.
- Wear does not match the number
A worn pedal rubber, a shiny steering wheel and a fresh-looking odometer belong to different cars. Physical wear is slower to fake than a digit.
- A gap in the record
Years with no recorded reading are where a rollback fits. The title history shows when readings were captured and when they were not.
- “Exempt” or “not actual” on the title
Those are formal odometer brands, and they travel with the vehicle. A brand means the reading is not certified as true — which is a different and more serious thing than high mileage.
Sources
- FHWA, Highway Statistics 2023, Table VM-1
Annual vehicle-distance travelled and vehicles registered, by vehicle type. The source of every per-vehicle figure on this page.
- FHWA, Highway Statistics 2023, Tables VM-2 and MV-1
Vehicle-miles by state and vehicles registered by state — the two columns behind the state comparison.
- NMVTIS
The federal title database whose odometer readings a VIN check reads back. Operated by the US Department of Justice.
FHWA tables are works of the US Department of Transportation and are in the public domain. Pulled 10 September 2026.
Keep going
This page is about the annual rate. That one is about the total on the clock and when it stops mattering.
Read the odometer values recorded against a specific vehicle at each title transfer.
Decode year, make, model and plant before you weigh any mileage figure.
Mileage moves the number. See the valuation with the history attached.
Vérifiez toujours le VIN avant d’acheter
L’aperçu gratuit affiche les mentions au titre, le statut de vol et les rappels ouverts en quelques secondes, et signale s’il existe des dossiers d’accident et d’odomètre. L’historique complet est à 21,99 $ CAD — paiement unique, sans abonnement.
Average Miles Per Year FAQ
The questions people actually search around annual mileage, and what the federal record can and cannot settle.
What is the average miles driven per year?+
Across all light-duty vehicles in the United States the average is 11,106 miles a year, from FHWA Highway Statistics 2023, Table VM-1. Cars and small crossovers average 11,026 and full-size SUVs, pickups and vans average 11,360. Figures quoted near 13,662 are miles per licensed DRIVER — the same FHWA travel divided by 237,655,885 licence holders instead of by vehicles. A different measure, and a larger number.
Is 12,000 miles a year a lot?+
No. It sits just above the light-duty average of 11,106 miles a year, well inside ordinary use. A car driven 12,000 miles a year is neither a low-mileage find nor a worn one; what separates those two is how the miles were accumulated and what the title history shows, not the annual rate.
How many miles should a 10-year-old car have?+
At the 11,106-mile average, roughly 111,000 miles. Anything between about 72,189 and 149,931 is ordinary. A reading far below that band is worth a question rather than a celebration — unusually low mileage is one of the patterns odometer rollback produces.
Do motorcycles and trucks average the same mileage?+
Not remotely. Motorcycles average 2,121 miles a year and combination trucks — tractor-trailers — average 58,890, roughly 28 times as far. That is why "is this high mileage?" has no answer until you say what kind of vehicle it is.
Can I tell if an odometer has been rolled back from the mileage alone?+
No. An annual average tells you whether a reading is unusual, not whether it is honest. A rollback is caught by comparing the reading against the odometer values recorded at each title transfer, inspection and auction sale — which is what a VIN check reads out of NMVTIS. Free on this page; the full report is $14.99.
Check the odometer before you trust it
Free VIN decode and recall check. The full history report — title brands, odometer records, salvage and auction photos — is $14.99.
Or get the full VIN history reportVérifications VIN connexes
Plus d'outils pour vérifier l'historique de tout véhicule